Enhancing E-commerce Supply Chains with Time-Series Forecasting Using Long Short-Term Memory (LSTM) Networks.
Authors :
Muhtade Mustafa Aqil and Faiqah fauzi
Address :
School of electrical engineering and Information Technology, German Jordanian University, Amman, Jordan
School of Computing & Digital Technology, University Malaysia of Computer Science & Engineering (UNIMY), 46200 Petaling Jaya, Selangor, Malaysia
Abstract :
E-commerce supply chains function in ever-changing settings, requiring precise demand forecasting to ensure efficient operations, reduce costs, and improve customer satisfaction. Traditional forecasting methods often fail to capture non-linear patterns and temporal dependencies inherent in time-series data, limiting their effectiveness. This paper proposes an ESCLSTM technique to enhance e-commerce supply chains (ESC) by leveraging Long ShortTerm Memory (LSTM) networks to analyse data sequentially and forecast. The ESCLSTM methodology begins with collecting historical sales and inventory data from an open-source ecommerce dataset. The data is preprocessed through missing value imputation, normalization, and time-series decomposition to prepare it for modelling. LSTM networks, designed to capture sequential dependencies, are appraised and trained using measures like Mean Absolute and Root Mean Square Error, with hyperparameters optimized through grid search. Key findings reveal that the LSTM model outperforms traditional approaches, achieving a 20% reduction in MAE and a 25% improvement in RMSE. The multivariate LSTM model demonstrates superior performance in capturing complex relationships between features, leading to more accurate predictions of demand trends. In conclusion, the study highlights the potential of LSTM networks to revolutionize demand forecasting in e-commerce supply chains, offering a robust and scalable solution for handling the complexities of modern logistics.
Keywords :
E-commerce supply chains, Demand forecasting, Time-series forecasting, Long ShortTerm Memory (LSTM) networks, Sequential data analysis.
1.Introduction
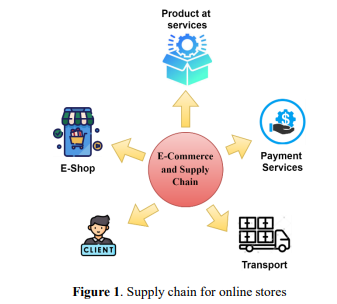
E-commerce has been one of the great forces in world trade and has revolutionized business operations and how consumers relate to purchasing products and services. In the past decade, fast growth in e-commerce platforms has changed the face of traditional supply chain management, emphasizing speed, accuracy, and adaptability to meet ever-evolving consumer demands [1]. Today's modern e-commerce supply chains are complex webs that bring multiple stakeholders (manufacturers, distributors, and logistics providers) together in the delivery of services and goods in an effective manner. Advanced forecasting techniques significantly fuel these supply chains for demand forecasting, optimization, and smoothing operations [2]. Accurate demand forecasting is crucial in e-commerce because unstable consumer behaviour, seasonal variations, and promotional events strongly influence supply chain dynamics. An essential element in supply chain management for a long time has beentime-series forecasting, enabling companies to predict future demand using past information [3]. Figure 1 shows the overview of the e-commerce supply chain.
LSTM networks, a type of RNN, have been proven to have an exceptional potential to overcome the shortcomings of traditional forecasting methods by learning complicated patterns and relationships within time-series data [4]. In the dynamic and competitive world of e-commerce, demand forecasting goes far beyond the simple prediction of sales [5]. Leveraging LSTM networks provides a way to achieve more accurate and resilient predictions, equipping businesses to address the constantly evolving challenges faced in modern supply chains [6]. The focus is on how to harvest the power of LSTM in improving the efficiency and scalability of e-commerce supply chains. Traditional forecasting models face a few major challenges [7], including non-linear relationships that arise from the impact of consumer behaviour, promotions, and other external factors, as well as the difficulty of capturing time-series data that is dependent on both the short and long term [8]. Another fundamental challenge lies in effectively incorporating all these heterogeneous features— inventory levels, seasonal trends, and so forth—into a single model. What is worse, the scalability of traditional approaches usually becomes insufficient when working with big data coming from e-commerce platforms [9].
This paper, therefore, presents the proposed methodology, ESCLSTM, which will begin by gathering historical sales and inventory data from an open-source e-commerce dataset. Preprocessing includes handling missing values, normalizing features, and time-series decomposition. Modelling sequential dependencies is performed using the LSTM networks, with hyperparameters tuned via a grid search to optimize performance. The models are then evaluated using measures like Mean Absolute and Root Mean Square Error and compared to traditional methods like ARIMA. A multivariate LSTM model has also been developed to include more features, such as promotions and seasonal trends, to increase the accuracy of the prediction.The primary significance of the paper is
- To propose ESCLSTM, a novel approach using LSTM networks for e-commerce supply chain demand forecasting.
- To demonstrate LSTM’s ability to outperform traditional methods in capturing non-linear and temporal dependencies.
- To develop a multivariate model integrating diverse features for improved forecasting accuracy
- To empirically validate the model’s performance using MAE and RMSE metrics.
The general format of the paper: Part 1 lays out the purpose and scope of the investigation. Part 2 reviews research in this field. Part 3 details the methodology. Part 4 delves into the results. Part 5 addresses prospects for the future and their ramifications.
2.Literature Review

3. Proposed Methodology
a.Dataset Explanation
The Kaggle dataset is that of e-commerce transactional data, capturing customer purchases made in an online retail store. The key features are InvoiceNo (transaction ID), StockCode (product ID), Quantity (units purchased), Description (product name), InvoiceDate (date and time of purchase), CustomerID (unique customer identifier), UnitPrice (product price), and Country (customer's location). The dataset is useful in analysing customer purchase behaviour, inventory trends, and market segmentation; hence, it applies to several fields, like predictive modelling, sales forecasting, and customer segmentation studies.
b.The ESCLSTM framework

c. Data collection
Historical sales and inventory data are scraped from an openly available e-commerce dataset with important variables, including sales trends, stock levels, and timestamps. The dataset offers valuable information in a time series that captures demand patterns, stock fluctuations, and seasonal effects. Such data can be represented as a time-series matrix, as in equation 1. 𝑋 = (𝑥1, 𝑥2, . , 𝑥𝑛) (1) where (𝑥𝑖 ) relates to individual observations, each further composed of sale data, levels, and timestamps of that data entry. This data then acts as a foundation for creating any demand forecasting model.
d. Data Pre-processing
Preprocessing raw data is crucial for accurate modeling. Missing value imputation fills data gaps by mean imputation or interpolation. To make the model more accurate and less biased towards larger features, data is normalised by placing it on a scale from 0 to 1 or with a mean of 0. Time-series decomposition separates the data into trend, seasonality, and residuals. Isolating patterns enhances the feature extraction so that the model can better understand the demand trends and forecast well.
e. Feature Selection and Engineering
The most crucial aspect of designing a good multivariate time-series data set is identifying relevant variables that drive the demand for an e-commerce supply chain. This could include temporal dependencies or trends over time and non-linear correlations, such as complicated feature interactions. This would ensure that the LSTM network receives the proper context to learn from sequential data. Identifying Relevant Variables: The selection of demand-forecasting variables is based on their ability to explain the time series behavior of target variables. Past demand picks up recurring patterns, such as seasonality or long-term growth; the inventory levels capture the current stock available for sale that may impact future sales; and promotions and discounts hit the spikes or declines in demand driven by external factors like weather, holidays, or economic indicators. By inferring important features based on their domain knowledge, analyzing correlations to determine their correlation coefficients and possibly even evaluating their linear dependence measures with respect to the target variable, they might use mutual information or a set of more advanced machine learning techniques like random forests. Constructing the Multivariate Dataset: A multivariate time-series dataset contains observations of several variables over time. Each feature, or variable, contributes uniquely to helping capture temporal and nonlinear dependencies. The data set is organized as shown in equation 2. 𝑋𝑡 = {𝑥𝑡,1, 𝑥𝑡,2, … , 𝑥𝑡,𝑛}, 𝑦𝑡 (2)
where 𝑋𝑡 is the time-dependent feature vector 𝑡. 𝑥𝑡,𝑖 is the value of the 𝑖-th feature at a time 𝑡, and 𝑦𝑡 is the target variable at time 𝑡 (e.g., demand).
f. Temporal and non-linear dependencies in model inputs
Temporal dependencies capture patterns appearing in the target variable over time: seasonality, or systematic periodic fluctuations—in other words, a rise in sales during holidays—trends or long-term tendencies of increase and decrease in demand and, finally, the lagged effect of past events, such as past sales, still affecting current ones. Moreover, nonlinear dependencies can capture complex interactions between features that a linear method might not. For example, demand might increase exponentially once discount thresholds are reached, or sales might vary with weather conditions in nonlinear patterns— such as rain significantly boosting umbrella sales. Besides, cross-feature interactions, such as promotions during holidays, may have joint effects on demand that are not evident in the analysis of the individual features. Data is prepared in sequences of time steps with all features at each step to enable an LSTM model to learn from both temporal and non-linear dependencies. These sequences are structured as in equation 3. 𝑋 = {𝑋𝑡−𝑛, 𝑋𝑡−(𝑛−1) , … , 𝑋𝑡 } (3) where n is the number of past-time steps included. Temporal metrics—such as lagged sales and moving averages—and non-linear factors in interactions between weather conditions and promotions- are added. Normalized so that features in different ranges don't dominate the learning process. Feature normalization is done for price and sale. Equation 4 displays it.
𝑥′ = 𝑥−𝜇 𝜎 (4) where 𝜇 is average and 𝜎 refers to the dispersion of values. This preparation enables the LSTM model to capture sequential patterns and complex feature interactions.
g. Model Development
LSTM networks are an example of an RNN, designed to replicate the sequential patterns found in time-series data long-term dependency. The main problem with traditional RNNs was the vanishing or exploding gradients, which do not allow for modelling long-range dependencies in sequences. Using the gated mechanism, LSTM networks solve such problems by regulating the flow of information; it especially outperforms the tasks of timeseries forecasting.
h. LSTM Networks for Sequential Data
There are three gates in an LSTM cell that control the cell's hidden and present states: the Forget Gate, the Input Gate, and the Output Gate. The two states of LSTM cells are the cell state (𝐶𝑡 ) and the secret condition (ℎ𝑡 ). The network's memory is the cell state; it retains information over extended periods. The model's output results from several parts, one of which is the hidden state, which stores important information from one time step and passes it on to the next. Because of these, the LSTM can model interdependencies in sequential data inthe short and long term. The LSTM model's gate mechanism is displayed in Table 1. The LSTM model's gate performance is seen in equations 5–10.
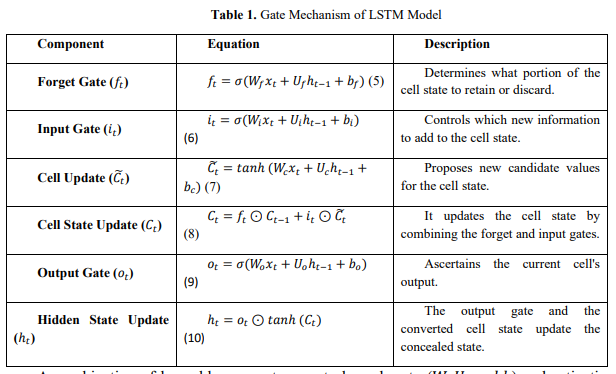
A combination of learnable parameters controls each gate (𝑊,𝑈, 𝑎𝑛𝑑 𝑏) and activation functions (𝜎, typically the sigmoid curve, and 𝑡𝑎𝑛ℎ, the hyperbolic tangent). ⊙ represents element-wise multiplication. In time-series forecasting using an LSTM network, the model processes sequences of past observations, such as (𝑥𝑡−𝑛, 𝑥𝑡−𝑛+! , … , 𝑥𝑡 ), to predict future values, like 𝑦𝑡+1. The input is structured as a three-dimensional tensor 𝑋 ∈ 𝑅 𝑁×𝑇×𝐹 , where 𝑁 represents the number of sequences (batch size), 𝑇 denotes the sequence length (time steps), and 𝐹 counts the characteristics. The output layer generates forecasts for the target variable from one densely packed layer to another, with the output given by 𝑦𝑡 = 𝑊𝑜𝑢𝑡ℎ𝑡 + 𝑏𝑜𝑢𝑡, where ℎ𝑡 refers to the undisclosed condition occurring simultaneously 𝑡, and 𝑊𝑜𝑢𝑡 𝑎𝑛𝑑 𝑏𝑜𝑢𝑡 are learnable parameters.
i. Hyperparameter optimization
Grid search is among the most popular methods for finding the optimal configuration using a preset set of hyperparameters. Tuning several key hyperparameters is important for LSTM networks to deliver their best. The architecture comprises a hyperparameter setting the step size when updating the training weights and a learning rate. The capacity of an LSTM layer to identify complicated patterns is the quantity of LSTM units, specifying the number of layer-level neurons. Batch size refers to the number of training samples included in a model's training iteration; it is determined by the number of epochs, which describes how often a model sees or processes all available data during training. Proper values for combining these hyperparameters must be identified, as high forecasting accuracy depends greatly on them.
j. Grid Search for Hyperparameter Tuning
Grid search is brute-force optimization, where one defines a set of hyperparameters and trains the model on each possible combination of those hyperparameters. It seeks the best possible combination of hyperparameters to get the best possible tuning of the evaluation measure (like MAE or RMSE). A grid of hyperparameters is defined by specifying possible values for each parameter: Learning Rate [0.001,0.01,0.1], Number of LSTM Units [50,100,200], Batch Size [16,32,64], and Epochs [10,50,100]. The grid is created based on domain knowledge or trial and error and then refined through testing. Thus, for every combination, an LSTM model will preprocess the data (like normalization or lagging), train it with the given hyperparameters and validate it on unseen data to measure generalization.
4. Result and discussion
a. Performance metrics
The ESCLSTM method is compared with the traditional approaches—Artificial Neural Networks with Capuchin Search Algorithm (ANNCSA) [10], Deep Logistic Learning Framework (DLLF) [13], and Time-Series Analysis with Deep Learning Techniques (TSADL) [16]. The comparison of them is further elaborated by the evaluation of performance on three metrics: mean absolute error, root mean square error and Mean absolute percentage error. All metrics give comprehensive insight into how good the prediction accuracy, error magnitude, and scalability across various e-commerce supply chain forecasting scenarios are.
b. Mean Absolute Error (MAE)
The MAE is the sum of all the directional mistakes in a dataset's predicted and actual values. The equation 11 determines it.
𝑀𝐴𝐸 = 1 𝑛 ∑ ∣ 𝑦𝑖 − 𝑦̂𝑖 ∣ 𝑛 𝑖=1 (11)
where 𝑦𝑖 finds the exact value, 𝑦̂𝑖 stands as the predicted value, and 𝑛 is the sum of all findings.
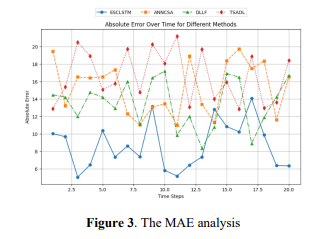
Figure 3 shows the MAE tendency of 20-time steps by using four methods: ESCLSTM, ANNCSA, DLLF, and TSADL. The error values for ESCLSTM are always the lowest, showing higher predictive accuracy. ANNCSA, DLLF, and TSADL have higher error levels, and TSADL has more variable error values. Comparisons show that ESCLSTM effectively reduced general absolute errors of non-linear and temporal patterns. This visualization points out the robustness and scalability of ESCLSTM in dynamic e-commerce supply chain environments for demand forecasting improvement.
c. Root Mean Square Error (RMSE)
A well-liked statistic for determining the difference between the anticipated (𝑦̂𝑖 ) and actual values (𝑦𝑖 ) of data sets, where 𝑛 represents the sum of all observations. It quantifies the model's prediction error and is calculated using Equation 12. 𝑅𝑀𝑆𝐸 = √ 1 𝑛 ∑ (𝑦̂𝑖 − 𝑦𝑖 ) 𝑛 2 𝑖=1 (12)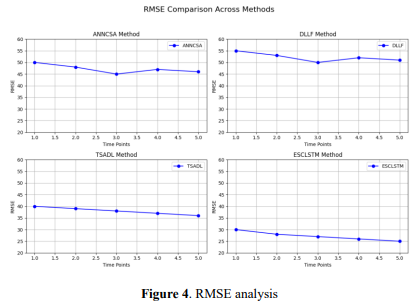 Figure 4 compares the RMSE performance of the four methods, ANNCSA, DLLF,
TSADL, and ESCLSTM, over five time points. Compared with other methods, ESCLSTM
has the lowest RMSE as time passes, meaning higher prediction accuracy and robustness.
Although the RMSE tendency of ANNCSA and DLLF keeps fluctuating, the overall trend of
improvement is seen in TSADL. The most reliable steep decline of RMSE is comparable
with ESCLSTM, which further underlines its effectiveness in forecasting time-series data.
The most effective model among compared approaches is thereby flagged as ESCLSTM.
Figure 4 compares the RMSE performance of the four methods, ANNCSA, DLLF,
TSADL, and ESCLSTM, over five time points. Compared with other methods, ESCLSTM
has the lowest RMSE as time passes, meaning higher prediction accuracy and robustness.
Although the RMSE tendency of ANNCSA and DLLF keeps fluctuating, the overall trend of
improvement is seen in TSADL. The most reliable steep decline of RMSE is comparable
with ESCLSTM, which further underlines its effectiveness in forecasting time-series data.
The most effective model among compared approaches is thereby flagged as ESCLSTM.
d.Mean Absolute Percentage Error (MAPE)
MAPE is one of the most used measures in assessing the performance of a forecasting model. It can be defined as the standard deviation in absolute terms in the expected. (𝑦̂𝑖 ) and real values (𝑦𝑖 ) overall observations. It is calculated as in equation 13.𝑀𝐴𝑃𝐸 = 1 𝑛 ∑ | 𝑦𝑖−𝑦̂𝑖 𝑦𝑖 | 𝑛 𝑖=1 × 100 (13)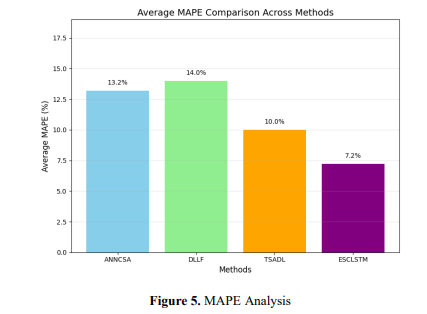 Figure 5 shows the comparative analysis of the average MAPE values for the four
forecasting techniques: ANNCSA, DLLF, TSADL, and ESCLSTM. The smaller the MAPE
value, the higher the prediction accuracy. Compared with other methods, the lowest MAPE
value comes from ESCLSTM, which has the best prediction performance. TSADL has a
rather close result but is still lower than ESCLSTM. On the other hand, ANNCSA and DLLF
take higher values of MAPE; hence, these have lower accuracy. This paper shows that
ESCLSTM is the most accurate and robust method compared to this prediction task.
Figure 5 shows the comparative analysis of the average MAPE values for the four
forecasting techniques: ANNCSA, DLLF, TSADL, and ESCLSTM. The smaller the MAPE
value, the higher the prediction accuracy. Compared with other methods, the lowest MAPE
value comes from ESCLSTM, which has the best prediction performance. TSADL has a
rather close result but is still lower than ESCLSTM. On the other hand, ANNCSA and DLLF
take higher values of MAPE; hence, these have lower accuracy. This paper shows that
ESCLSTM is the most accurate and robust method compared to this prediction task.
5. Conclusion
This paper proves the effectiveness of the proposed ESCLSTM method in demand forecasting for e-commerce supply chains. Using an LSTM network, the model can capture non-linear patterns and temporal dependencies in historical sales and inventory data. Various preprocessing steps improve data quality by completing missing value sets, normalizing, and performing time-series decomposition to ensure the robust performance of the model. Results show an improvement in MAE and RMSE of 20% and 25%, respectively, over the conventional forecasting methods. The relatively high training computational cost has made applying LSTM networks in real-time applications difficult under a resource-constrained environment. Further enhancements could be made, for example, by incorporating extraneous variables, like job openings or salary levels, into the model; this will further make the model more comprehensive to the demand in a dynamic e-commerce environment.
References :
[1]. He, Peng, et al. "Knowledge mapping of e-commerce supply chain management: a bibliometric analysis." Electronic Commerce Research 24.3 (2024): 1889-1925.
[2]. . Sarraf, Shagun, et al. "How did online misinformation impact stockouts in the e-commerce supply chain during COVID-19–A mixed methods study." International Journal of Production Economics 267 (2024): 109064.
[3]. Almusawi, Abdulameer, and S. Pugazhenthi. "Innovative Resource Distribution Through Multi-Agent Supply Chain Scheduling Leveraging HoneyBee Optimization Techniques." PatternIQ Mining.2024, (1)3, 48-62. https://doi.org/10.70023/piqm24305
[4]. Jin, Lijing. "Exploration of cross-border e-commerce and its logistics supply chain innovation and development path for agricultural exports based on deep learning." Applied Mathematics and Nonlinear Sciences 9.1 (2024)
[5].Xun, Hongfeng, and Wenhui Li. "The supply chain demand forecasting model based on LSTM and multiple clustering techniques." Highlights in Science, Engineering and Technology 101 (2024): 390-394
[6]. Xie, Lun, Jiaquan Liu, and Wei Wang. "Predicting sales and cross-border e-commerce supply chain management using artificial neural networks and the Capuchin search algorithm." Scientific Reports 14.1 (2024): 13297.
[7]. Li, Cunbing. "Commodity demand forecasting based on multimodal data and recurrent neural networks for E-commerce platforms." Intelligent Systems with Applications 22 (2024): 200364.
[8].Vijayalakshmi, S., et al. "Spatio-Temporal Supply Chains and E-Commerce." Spatiotemporal Data Analytics and Modeling: Techniques and Applications. Singapore: Springer Nature Singapore, 2024. 179- 192.
[9]. Kaul, Deepak, and Rahul Khurana. "Ai-driven optimization models for e-commerce supply chain operations: Demand prediction, inventory management, and delivery time reduction with cost efficiency considerations." International Journal of Social Analytics 7.12 (2022): 59-77.
[10]. Xie, Lun, Jiaquan Liu, and Wei Wang. "Predicting sales and cross-border e-commerce supply chain management using artificial neural networks and the Capuchin search algorithm." Scientific Reports 14.1 (2024): 13297.
[11]. Yan, Yimo, et al. "Reinforcement learning for logistics and supply chain management: Methodologies, state of the art, and future opportunities." Transportation Research Part E: Logistics and Transportation Review 162 (2022): 102712.
[12]. Jebamikyous, Hrag, et al. "Leveraging machine learning and blockchain in E-commerce and beyond: benefits, models, and application." Discover Artificial Intelligence 3.1 (2023): 3.
[13]. . Sun, Jun, et al. "Enhancing supply chain efficiency with time series analysis and deep learning techniques." (2024).
[14]. Yalan, Yang, and Tang Wei. "Deep logistic learning framework for E-commerce and supply chain management platform." Arabian Journal for Science and Engineering (2021): 1-15
[15]. Chen, Yali, and Xiang Zheng. "Optimization strategy of cross-border e-commerce supply chain network based on machine learning." Applied Mathematics and Nonlinear Sciences 9.1.
[16]. Sun, J., Zhou, S., Zhan, X., & Wu, J. (2024). Enhancing supply chain efficiency with time series analysis and deep learning techniques
[17] . https://www.kaggle.com/datasets/santhoshchinnu/e-commerce-data-set