Dynamic Pattern Analysis for Enhanced Predictive Intelligence in Smart Environments Using Transformer Learning Models
Authors :
Mohammad ameid alkato and Nekita kalenen
Address :
Faculty of Information Technology, Isra University, Amman, Jordan
school of Information science and computing, Donetsk National Technical University, Lviv region, 82111, Ukraine
Abstract :
Sophisticated prediction models are needed in intelligent settings to improve system efficiency, security, and customer satisfaction. This study on transformer-based time-lapse forecasting models for intelligent prediction covers numerous occurrences, including energy management, enhanced assistance for driver infrastructure, and in-car technologies. The recommended method identifies permanent correlations and complex temporal patterns in multi-feature collections employing self-focus. The Transformer's topology is developed to forecast time series. The information set is ready for abnormality recognition, event estimation, and trend assessment by cleaning and classifying the event types with different activity rates. The simulation of the Transformer receives the actual data set. Important findings reveal that the Transformer-based approach forecasts consecutive network configurations more accurately and consumes less computational resources than conventional techniques. The model's capabilities for identifying outliers and adjusting event distributions promote adaptive ambient decision-making price; subsequently, the Transformers technique lays the groundwork towards AI prediction, particularly improving sophisticated systems' capacity to interpret the meaning of complex influenced by events stream of information.
Keywords :
Predictive Intelligence, Transformer Model, Time-Series Forecasting, Smart Environments, Anomaly Detection.
1.Introduction
In conveyance, homes, and industrial automation, "intelligent circumstances" exist. Such scenarios necessitate efficient, secure, and usable connected systems. ADAS, intelligent energy consumption, and in-car technology provide significant real-time data [1]. Conventional statistical techniques cannot comprehend this information because of its interconnections and complex cycles of time. Sophisticated ecosystems require predictive intelligence to recognize issues, generate preventive selections, and improve processes.[2] Notwithstanding technological advances, statistical approaches and fundamental neural network procedures cannot handle the huge amount of smart environmental data, its complexity, and periodic relationships. Scalability is extremely complex datasets, and long-term connections challenge these methods [3,4]. Complicated algorithms that manage sequential data, discover patterns, and make realistic predictions at all times require development as organizations become more linked. The research project focuses on how regular forecasting algorithms can't grasp the complicated and constantly shifting event dynamics of smart surroundings. The events include air conditioner heat needs, energy management fuel stages, ADAS system performance, and window and door sensing conditions. Occurrence incidence and intricacy differ across grouping, rendering pattern retrieval challenging [5].
Conventional models are highly computational and infrequently adapted throughout time. To solve that, researchers provide a Transformer-based Time-Series Prediction Framework for adaptive environment dynamical analysis of patterns. Originally designed for conversational processing, transformers can incorporate complicated sequential information links and long-term relationships. Following collection preprocessing for uniformity and precision, feature development removes spatial characteristics. After analyzing data, the Transformer finds outlier predictions and analyzes trends.
a) Contributions of the Study:
- AI that is more advanced and accurate Assessing complicated time-related data in smart settings is a perfect fit for a transformer-based strategy, which greatly enhances computational effectiveness and accuracy in prediction[6].
- Reactive Recognition of Patterns may successfully spot irregularities, forecast future trends, and identify long-term relationships in various event types.
- Flexible with the capacity to grow, The design can easily handle deployments in real life and adjust to changing trends in information, guaranteeing that the platform's throughput is continuously improved[7].
The rest of the article is organized like this: The second section provides a literature review and discusses current approaches to predictive intelligence in smart settings. In Section 3, the dataset, as well as the methods used for preprocessing and feature engineering, are detailed. The model based on Transformers is described in Section 4, along with its design and implementation details. Section 5 showcases the outcomes of the experiments, evaluation measures, and performance comparisons. The results, consequences, and possible practical uses are covered in Section 6. Section 7 provides a comprehensive study summary and suggests avenues for further investigation.
2. Literature Survey
Ramesh et al.[8] The implied investigation detects distributing transformer anomalies using the Separation Forests Method. Internet of Things (IoT) sensor modules on transformer distributors measured a single phase current at the load, soil humidity, and oil content. The technology detects possible defects with an accuracy rate of 92% and gives a 24-hour time frame for prediction fault investigation. The equipment's requirement for constant internet access and restricted surroundings hinder its operation in hard or distant areas. Smart electrical systems benefit from efficient upkeep and defect detection using this IoT method.
Xu et al.[9]The present research utilizes a collection containing electrical grid impulses that capture errors, deviations, and multi-label grid incidents, and it uses Thermal Fusion Transformers (TFT) and Variational Autoencoders (VAEs) to analyze patterns in multidimensional time-series information. Although the VAE offers excellent representations of hidden spaces, its findings show that TFT delivers better flexibility, lower runtimes, and greater precision in finding temporal trends. Appropriate variable tweaking is required for complicated data sets, and VAE latent outputs are less interpretable. This paradigm enhances problem detection and decision-making across urban and environmental systems by displaying historical trends with reduced dimensions, facilitating artificial intelligence explanation.
Sun et al.[10] Global freshwater shortages and sustainable water resource development need wastewater reuse. Optimizing wastewater utilization requires precise input volume estimates in water treatment plants. Traditional and decomposition integration methods for non-stationary temporal data are peak and anomaly-sensitive: real-time rolling predictions and differential decomposition aid. After ML prediction, the model uses differential decomposition with Complete Ensemble Empirical Mode Decomposition with Adaptive Noise—Outlier-sensitive Time-Aware Transformers for prediction integration. Fundamental ML, decomposition integration, and Transformer-based models increased ML-CEEMDAN-TSTF accuracy. The hybrid technique offers time-scale differential information, complicating environmental data prediction and adaptation. TS-Transformer made the model more sensitive to time series anomalies and peaks to manage anomalous data, water volume uncertainty, and low forecasting accuracy. Time-scale differential information enhanced model accuracy, Ts-Transformer-based decomposition integration model beat LSTM, and ML-CEEMDAN-TSTF beat Transformer. This accurate and reliable reclaimed water measurement helps clean water and water environment management research.
Laayati et al.[11] The insurmountable flow of electricity from the enormous integration of distributed energies, energy storage facilities, and electric vehicle charging stations has rendered grid energy management challenging. Achievements, power outages, and electrical transformer detonations in electrical substations can result. Electrical substations can use sophisticated sensors and innovative management and tracking techniques with Energy 4.0 in Smart Grids. Diagnose computations, Wellness Ranking, and life-loss estimation are used to create a composite artificial neural multilayer for transformers that provide power. A multi-dataset methodology study on comparisons chooses the best models. Evolutionary science supported vector machine, randomly generated forest, the k closest fellow man, and parametric regression-based predicts associated with an electronic energy transformer monitoring device establish notification important performance metrics and decide on control of loads, energy factor, and signal picks in this mixed-architecture system for predictions (PHM) health control.
Muthulingam et al.[12]Because of precision reduction, complexity of time, and greater rate of errors, algorithms for deep learning may struggle to safeguard home automation data. In a novel method, the Protecting Intelligence Household through a Transformers-Based IoT Intrusion Detection System, or IDS, employing an Optimal Cross-Contextual Endpoint Runner Metropolis Play Transformers Networks tackles these concerns Sophisticated DL approaches boost smarter household safety and reliability in this unique System. The research project employs the Grid-Constrained Information Cleansing Procedure (GCDP)-preprocessed IoT_bot collection for excellent quality input. The Giant Trevally Optimizer Algorithm (GTOA) finds some of the most significant attributes to enhance categorization from cleansed data. Segmentation employs sophisticated residence safety framework O2CPRCG-TransNet. Somewhat Homomorphic Fuzzy-based Elliptic Curve Cryptography secures data transport. The proposed solution beats previous methods with 98% accuracy and 0.993 recall in Python experiments. The outcomes prove the approach's effectiveness and potential for adaptive protection of your home.
Wang et al.[13] IoT-connected cities with sensors need load control for the conservation of energy. The paper proposes AI-enhanced Multiple Learning-to-Learning (MSLL) phases for network safety and load monitoring. The recommended method uses MMStransformer, a model based on transformers for multifaceted, correlated information and prediction of load-distant interactions. The MMStransformer multi-mask learning-to-learning method maximizes computer performance while losing precision in prediction. Atmospheric and operational variables are analyzed since urban surveillance statistics are fluid and complex. Internet of Things (IoT) privacy and safety are addressed for confidential information handling and exchange. Compared with conventional estimates and established methods, laboratory findings suggest the novel technique works. Studies have found that applications based on AI increase load forecasting and infrastructure for smart city reliability. Artificial intelligence solutions for sustainable urban planning and energy management are developed here.
Sana et al.[14] attempts to identify anomalies in connected devices; the study uses models that have been tuned using Bayesian methodologies, such as Vision Transformers (ViT), Long Short-Term Memory (LSTM), Random Forest, and Ensembles Obtained Forest. Containing ViT, we were able to achieve 100% success rates and near-perfect metrics for training (accuracy >99.90%, AUC = 1.00) on the dataset, which contains multidimensional IoT attack information with complicated structures; however, our verification performance for the models trained using deep learning is still lower at 78.70%. Some drawbacks include the possibility of excessive fitting during development and difficulties in deploying the model in actual-life situations caused by irregular data. Research presented here demonstrates effective ways to use state-of-the-art ML and DL techniques to improve the detection of attacks throughout the IoT.
3. Proposed Methodology
a) Transformer-Based Prediction Framework
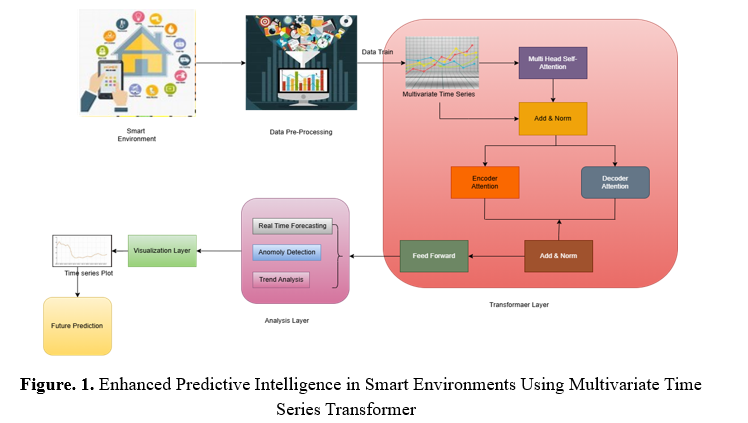
In intelligent settings, the network's design describes a chain of processes that handles information and makes predictions. Things like heating and cooling systems, power management software, and driving assistance technologies are examples of IoT devices that gather multimodal data in time series. The preconditioning procedure data helps with noise removal, missing information handling, and trustworthiness guarantees. A Transformer-based framework receives the cleaned-up material. Anomalies and anticipates trends instantaneously, encoder-decoder sections examine relationships between data elements, and multi-head self-awareness collects chronological connections. The dashboards show information, anomalies, and trends that may be used for proactive intelligence gathering in a graphical overlay. Finally, the System has a module for predicting the future, which provides reliable predictions to help intelligent surroundings make choices.
b) Multivariate Data Preparation
The multitude of Internet of Things (IoT) instruments used in bright settings collect information about various types of events, including those related to HVAC (such as heat requests), managing energy (such as fuel level positions), and advanced driver assistance systems (such as APA function status). A time-lapse structure is used for gathering information, which helps maintain the chronological linkages important for analyzing patterns. Quantitative data (such as thermometers and pressures), qualitative data (such as whether the door is open or closed), and boolean indications (such as whether the entire System is on or off) are all part of the multidimensional streams of information captured by connected device sensors. Preconditioning methods are used to handle unavailable values, reduce noise using flattening techniques, and remove redundancies produced by multiple communications or logging mistakes from raw data collected from sensors. Ensures that the data is precise as well as complete. Certain actions are taken to increase data dependability when gathering information.
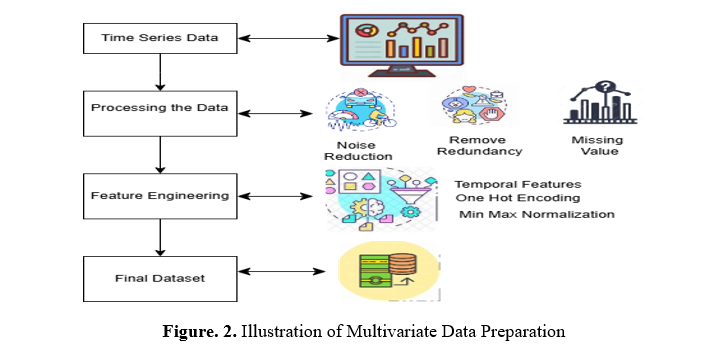
Data collection is enhanced for investigation using Transformers through the creation of features. Mathematical attributes are often normalized using characteristic approaches like min-max standardization, whereas parameters containing subcategories are encrypted using techniques like one-hot encoding. Recurring patterns, it is possible to exclude time-of-day and day-of-the-week signals and other historical variables. After much sorting, all the information is ready for computational modelling. Initial visualizations like heatmaps, tools for transforming information like Pandas, mathematical computing tools like NumPy, and feature change tools like Scikit-learn are utilized to guarantee proper preparation.
c) Transformer Model Training Data
Prospective reasoning for intelligent settings is built upon the Transformers Modeling Training Component. This section aims to create a Transformer design that can capture complex time-dependent relationships and connections. The information set includes different occasion classifications, such as "Heat Request" for air conditioning activities and "Gear Shift Position" for equipment and acceleration measurements. As an illustration, the design may prioritize different kinds of events, such as "Driver Buckle Status" under the Seat Adjustments classification or "APA Func Status" under ADAS, thanks to the Transformer's self-awareness procedure, which helps to provide a more complete picture of how different variables communicate with one another.
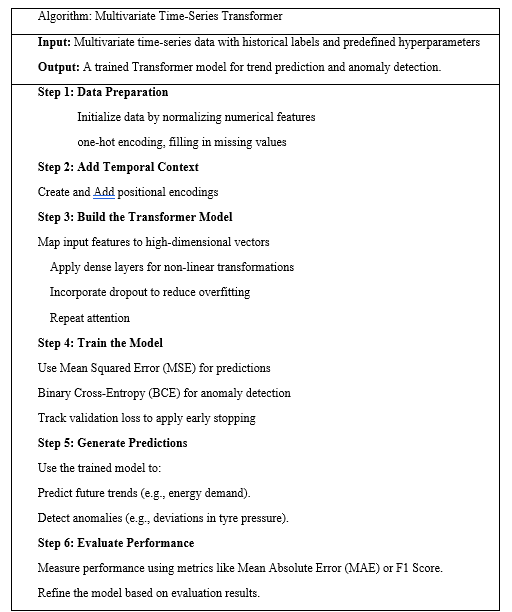
The Multivariate Time-Series Transformer predicts multidimensional trends and detects anomalies. First, the information is normalized, a single-hot encoded, and values that are missing are addressed. A positional encoded information improve time-series data organization by adding chronological perspective. The mathematical framework maps characteristics with numerous layers, drops out overfitting, and captures feature interactions with methods of attention. It receives instruction with Mean Squared Error for tendencies and Binary Cross-Entropy for abnormalities, halting promptly with validating losses. Effectiveness is measured by Mean Absolute Error and F1 Score for trend prediction and anomaly detection.
Characteristics like "Heat Request," "Fuel Level Position," and "Front Left Tire Pressure" are part of the heterogeneous time-series information that this algorithm examines. The various groups that this information comes from are "Air Conditioner," "Energy Management," and "Tire Monitoring." Processing starts with encrypting and standardizing these attributes, dealing with absent data, and splitting the information into analytical frames of defined sizes. Incorporating a period context is achieved by adding spatial encoded information. To aid in predicting incidents (e.g., "Remote Close Trunk Request") and anomaly detection (e.g., anomalous "Gear Shift Position"), a Transformer framework with paying attention layers finds correlations among inputs and time increments. Parameters such as MAE or F1 Score evaluate how well the model performs.
d) Intelligent Time-Series Analysis
To investigate and forecast evolving trends in multidimensional time-lapse information sets, the Forecasting and Assessment Component employs learning methodologies such as Transformers. It uses features to analyze patterns, find anomalies, and immediately forecast to improve forecasting abilities in intelligent settings. Now, let's get into the technical details:
1. Real-Time Forecasting
This functionality predicts future trends by learning temporal dependencies and relationships among categories (e.g., "Air Conditioner" and "Energy Management").
Given a time-series dataset X=[x_1,x_2,…….,x_t], where x_t Is the feature vector at time t, the Transformer model predicts the next time step value x_t+1:

Take into consideration that the "Fuel Level Position" data from the past may be used to forecastx ̂_t+1.
2. Anomaly Detection
Identifies deviations in event sequences from learned patterns by comparing actual and predicted values. Each event feature x_t can compute the prediction error

Flag an anomaly if e_t>τ.Example"Front Left Tire Pressure" (Tire Monitoring category)Actual pressure: x_t=30 PSI PSI.Predicted pressure: x ̂_t=28 PSI .Error e_t=|30-28|=2PSI If τ=1.5, the System flags this as an anomaly.
3. Trend Analysis
This function evaluates event frequencies and correlations between different categories. It helps identify patterns like recurring events or dependencies between features.
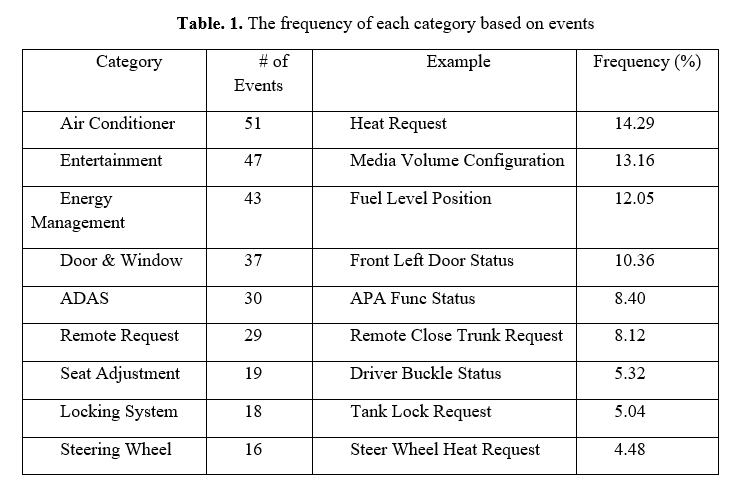
Event Frequency Analysis: The frequency of each category is calculated as:

For example, the Total number of events:51+47+⋯+9=357.Frequency of "Air Conditioner": Frequency(Air Conditioner)=51/357*100=14.29%
Event Correlation Analysis: The correlation between two categories (e.g., "Fuel Level Position" and "Gear Shift Position") is calculated using Pearson's correlation coefficient:
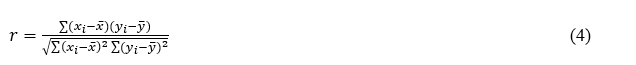
Where x_iand y_iAre values from the two categories, and x ̅and y ̅ .Correlation between "Ambient Light Status" and "Reverse Light Status":r=0.8, indicating a strong positive correlation.
e) Decision-Support and Visualization
The Transformer-based model's predictions and analyses are turned into interactive and actionable visual outputs by the Visualization and Decision Support Module, customized to the dataset's categories and values. As an example:
1. Data Visualization:
Show the number of instances of every class in a bar graph. An aggregate of 357 occurrences occurs, with 51 occurrences attributed to "Air Conditioner" (14.29%) and the fewest to "Window Wiper" (3 events, or 0.84%). Time-series plots show how an event has changed, such as how the "Fuel Level Position" metric in Energy Management has changed. Draws attention to times when energy use is high or low. Heatmaps: Connectivity heatmaps show how different categories relate to one another; for example, "Reverse Light Status" (Signal Lighting) and "Rear Mirror Fold Status" (Rear Mirror) are highly correlated.
2. Relevant Findings:
A "Front Left Tire Pressure" (Tire Monitoring) reading that suddenly falls below the predicted range or an unforeseen "Tank Lock Request" (Locking System) are two examples of anomalies that are detected based on model expectations. System optimization suggestions include energy use modifications, tyre maintenance warnings, and proactive safety checks for "Driver Buckle Status" (Seat Adjustment) abnormalities.
3. Interactions with Stakeholders:
Provides non-technical customers with dashboards that simplify patterns and trends. If we look at the distribution of events in the pie charts, we can see that "Air Conditioner" accounts for 14.29% of all occurrences, followed closely by "Entertainment" (13.17%) and "Energy Management" (12.04%). Alerting system operators to abnormalities in categories such as "Gear Shift Position" (Gear & Velocity) or "Ambient Light Status" (In-car Lighting) allows them to make decisions in real time.
4. Result Analysis
Several critical criteria are used to assess the efficacy of a Transformer-based model that examines multidimensional time-series information from classes like "Air Conditioner" (51 events, for example, Warm Requirement) and "Tire Monitoring" (9 events, for example, Front Left Tire Pressure). Accurately foreseeing "Fuel Level Position" trends in the Energy Management category is one example of how Mean Absolute Error (MAE) evaluates pattern projections. It does this by measuring the mean variance between fact and anticipated values. F1 Score is a precision-recall metric that assesses the ability to recognize anomalies; this is crucial for finding infrequent but serious abnormalities such as unanticipated changes to "Driver Buckle Status" or "Reverse Light Status." Lastly, R-Squared (R^2) evaluates the model's capacity to explain data variability, such as the correlations predicted between "Ambient Light Status" (In-car Lighting) and "Rear Mirror Fold Status" (Rear Mirror). Get ready to optimize your smart environment with these measures that reveal the model's prediction precision, detection of anomalies skills, and predictive ability.
a) Mean Absolute Error (MAE)

Bar graph comparing four models' Mean Absolute Error (MAE) values across dataset event categories: TFT, TCN, RNN-Transformer, and the Proposed Multivariate Time-Series Transformer. Examples of typical characteristics of car systems include the "Air Conditioner" category (51 events) and the "Entertainment" category (47 events). For example, "Fuel Level Position" (Energy Management) and "Front Left Tire Pressure" (Tire Monitoring) are two examples of the kind of events that each model attempts to forecast. The chart shows how well each model does at this. With lower MAE values, the proposed model demonstrates superior prediction accuracy in capturing event patterns compared to others.
b) F1 Score

Using event data from many categories, such as "Air Conditioner" and "Energy Management," allows graphs like this one to effectively demonstrate the interrelationships between the F1 scores of multiple models. Specifically, "Fuel Level Position" is within the purview of Energy Management, while "Front Left Door Status" is part of the Door & Window category. You'll find a combination of the above types in many car structures. By comparing the two algorithms' F1 scores, we can see which is better at predicting patterns and identifying exceptions for each data set. The previously Suggested Transformer approach showed better occurrence sequence forecasting abilities throughout the dataset, as indicated by higher F1 scores indicating higher accuracy. The reality that it achieved better results than rivals proved this to be true.
c) R-Squared (R^2)
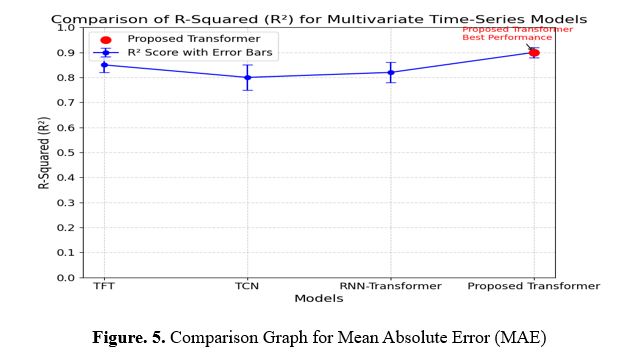
Based on their R-squared (R²) scores, the graph compares the performance of four models: TFT, TCN, RNN-Transformer, and Proposed Transformer. A higher value suggests a more accurate prediction, as it shows how well each model matches the dataset. Events from multiple categories, with varying frequencies of occurrence, are included in the dataset. These categories include Air Conditioner, Energy Management, and Signal Lighting. With the greatest R² score, the Proposed Transformer model outperforms the competition and can better capture temporal patterns across all these data types. This benefit is graphically shown in the graph with comments and error margins.
5. Conclusion and Future Work
According to this investigation, progress assessments, abnormal recognition, and incident predictions make employing Transformer-based devices in smart settings possible. The Transformer framework provided here makes more precise forecasts. It preserves more detailed geographic connections than previous techniques for occurrences with many factors, such as managing electricity and in-car devices. Machines can detect irregularities and predict prospective patterns, improving decision-making processes, protection, and user experiences. It performs adequately in the present moment due to its functioning well theoretically. Subsequent research may focus on optimizing the model's capacity for versatility to accommodate bigger databases with more frequency subcategories. The reference framework must be comprehensible since consumers must understand how choices are made, especially in highly critical areas such as energy planning and automotive security. Training reinforced may improve the statistical framework's immediate flexibility, resulting in greater precision forecasting and automatic system changes. Testing the algorithm in different situations and situations from other fields can help you comprehend its durability and versatility.
References :
[1]. Almeida, A., Bermejo, U., Bilbao, A., Azkune, G., Aguilera, U., Emaldi, M., ... & Arganda-Carreras, I. (2022). A Comparative Analysis of Human Behavior Prediction Approaches in Intelligent Environments. Sensors, 22(3), 701.
[2]. Panduman, Y. Y. F., Funabiki, N., Fajrianti, E. D., Fang, S., & Sukaridhoto, S. (2024). A Survey of AI Techniques in IoT Applications with Use Case Investigations in the Smart Environmental Monitoring and Analytics in Real-Time IoT Platform. Information, 15(3), 153.
[3]. Hanif, M. F., & Mi, J. (2024). Harnessing AI for solar energy: Emergence of transformer models. Applied Energy, 369, 123541.
[4]. Hameed, A., Violos, J., Leivadeas, A., Santi, N., Grünblatt, R., & Mitton, N. (2022). Toward QoS prediction based on temporal transformers for IoT applications. IEEE Transactions on Network and Service Management, 19(4), 4010-4027.
[5]. Naveed, M. S., Hanif, M. F., Metwaly, M., Iqbal, I., Lodhi, E., Liu, X., & Mi, J. (2024). Leveraging advanced AI algorithms with transformer-infused recurrent neural networks to optimize solar irradiance forecasting. Frontiers in Energy Research, 12, 1485690.
[6]. McMurray, S. (2024). Semantic Aware Environment Spatial-Temporal Graph Transformer: A Single-Agent Multi-Class Trajectory Prediction Framework.
[7]. Rajaram, Sampath. "A Model for Real-Time Heart Condition Prediction Based on Frequency Pattern Mining and Deep Neural Networks." PatternIQ Mining.2024, (01)1, 1-11. https://doi.org/10.70023/piqm241
[8]. Ramesh, J., Shahriar, S., Al-Ali, A. R., Osman, A., & Shaaban, M. F. (2022). Machine Learning Approach for Smart Distribution Transformers Load Monitoring and Management System. Energies, 15(21), 7981.
[9]. Xu, H., Boyaci, A., Lian, J., & Wilson, A. (2024). Explainable AI for Multivariate Time Series Pattern Exploration: Latent Space Visual Analytics with Time Fusion Transformer and Variational Autoencoders in Power Grid Event Diagnosis. arXiv preprint arXiv:2412.16098.
[10]. Sun, X., Zhang, L., Wang, C., Yang, Y., & Wang, H. (2024). Dynamic real-time prediction of reclaimed water volumes using the improved transformer model and decomposition integration technology. Sustainability, 16(15), 6598.
[11]. Laayati, O., El Hadraoui, H., El Magharaoui, A., El-Bazi, N., Bouzi, M., Chebak, A., & Guerrero, J. M. (2022). An AI-Layered with Multi-Agent Systems Architecture for Prognostics Health Management of Smart Transformers: A Novel Approach for Smart Grid-Ready Energy Management Systems. Energies, 15(19), 7217.
[12]. Muthulingam, G. A., Dhasmana, G., Purushothaman, S., Honnaiah, S., Ronald, B., & Soudagar, M. E. M. (2024, October). Advanced IoT Intrusion Detection for Intelligent Homes using Optimized Cross-Contextual Transformers with a Dynamic City Game Framework. In 2024 8th International Conference on I-SMAC (IoT in Social, Mobile, Analytics and Cloud)(I-SMAC) (pp. 130-136). IEEE.
[13]. Wang, B., Dabbaghjamanesh, M., Kavousi-Fard, A., & Yue, Y. (2024). AI-enhanced multi-stage learning-to-learning approach for secure smart cities load management in IoT networks. Ad Hoc Networks, 164, 103628.
[14]. Sana, L., Nazir, M. M., Yang, J., Hussain, L., Chen, Y. L., Ku, C. S., ... & Por, L. Y. (2024). Securing the IoT Cyber Environment: Enhancing Intrusion Anomaly Detection with Vision Transformers. IEEE Access.